Cats2D Multiphysics > Developments > Spirograph
Spirograph
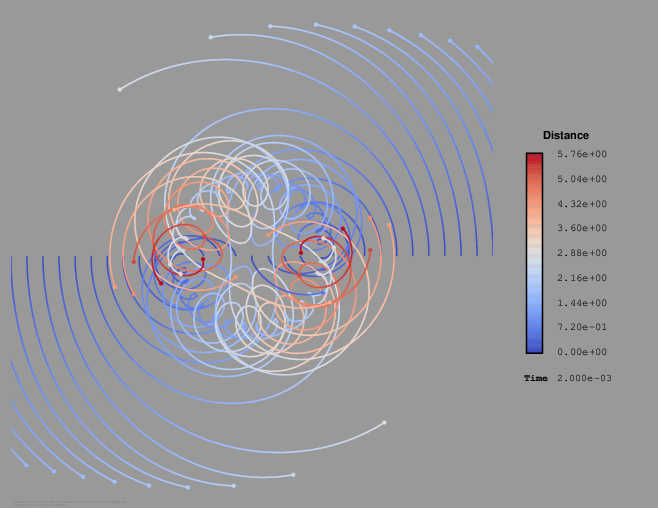
Mouse over this image to animate the paths traveled by a line of particles released along a horizontal line through the centers of a pair of decaying Lamb-Oseen vortexes.

Below I compare pathlines and streaklines after 0.001 seconds of decay. In the streakline visualization shown on the right, the vortex centers quickly become a jumbled mess of particles, but lines of particles outside the vortex centers closely resemble the pathlines shown on the left. After this short amount of time the two representations are not terribly different.

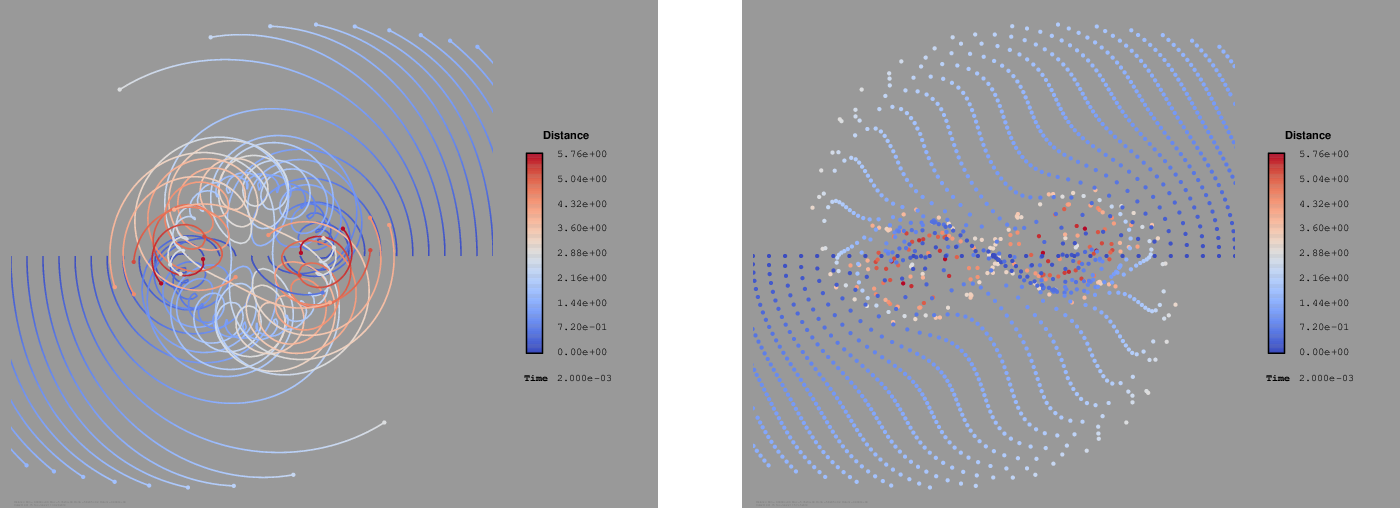
After 0.002 seconds the streaklines outside the vortex centers still form distinct lines, but these no longer closely resemble the actual pathlines, having buckled in shape compared to them. Also the pathlines have begun to obscure the underlying topology of the flow, which remains clearly distinguished in the streakline visualization.

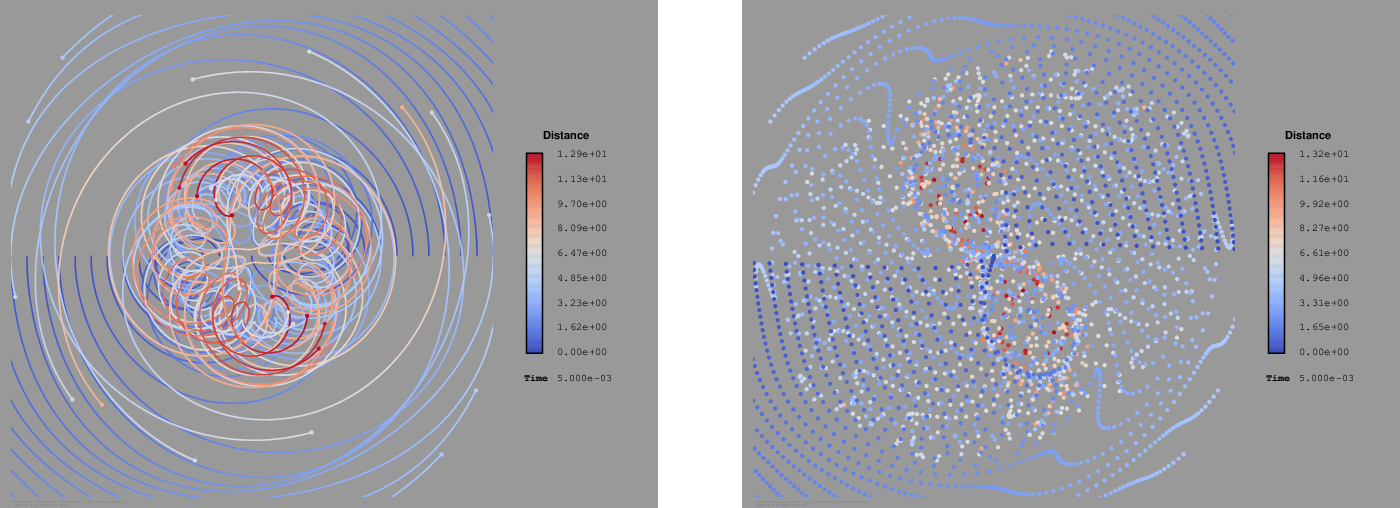
After 0.005 seconds the streaklines have begun to cross over themselves and now look quite different than the pathlines. The flow topology can still be faintly recognized at the center.

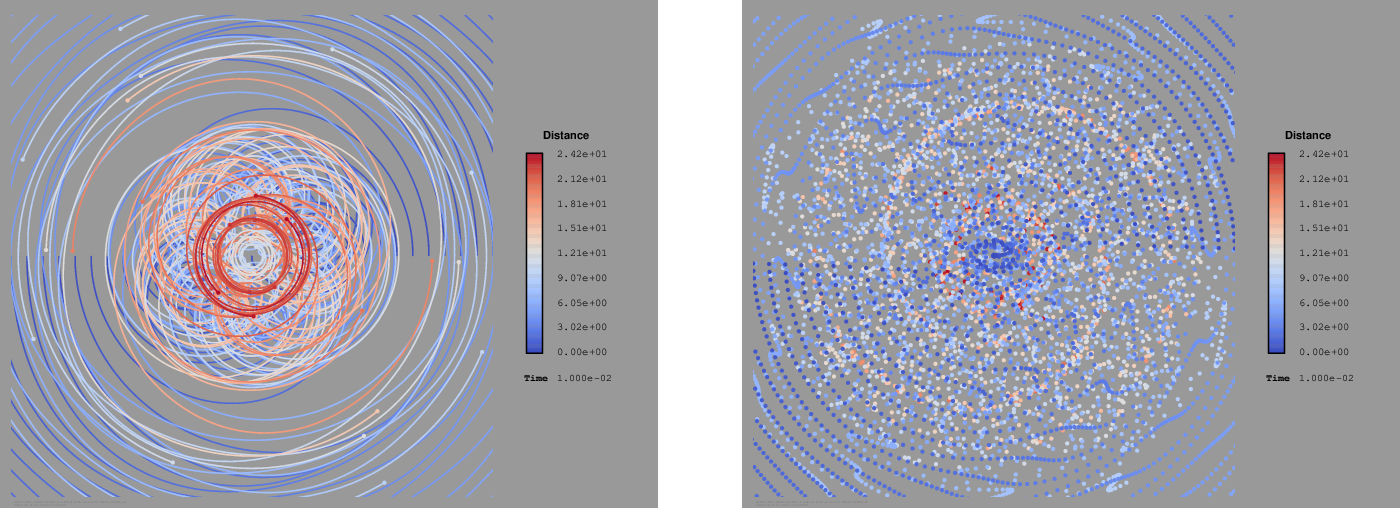
After 0.01 seconds particles with long lifetimes no longer remain in discernible lines in the streakline visualization and seem fairly uniform in their distribution. In the pathline visualization a ring shape region largely denuded of particles has appeared, but this seems to be an artifact of releasing all the particles at one time along a single line, which is arbitrarily restrictive.

These two visualizations give a different look to the problem that I am still trying to digest.