Cats2D Multiphysics > Research Topics > Streamlines, pathlines, and streaklines
All unpublished results shown here are Copyright © 2016–2019 Andrew Yeckel, all rights reserved
Streamlines, pathlines, and streaklines
I'm not going to explain the difference in terms of mathematical formalism except to remind you that they are equivalent in a steady flow and different in a time-dependent flow. Read this article if you're not sure. Instead I will illustrate the differences for a particular time-dependent flow, the merger of two vortexes.
Streamlines
The calculation shown here reproduces the work of Brandt and Nomura. The initial condition is a superposition of two Lamb-Oseen vortexes of equal strength. Periodic conditions are applied to all boundaries, so the calculation represents an infinite field of vortex pairs. The vortexes rotate in the same direction and must be connected by a saddle. As time proceeds the vortexes decay in strength and their centers move closer until they merge into a single vortex. Mouse over the image to see the animation.
The streamlines of this flow are simple and easy to comprehend. They give me the impression that particles mostly circulate on simple closed paths. But they show the instantaneous direction of the flow rather than the paths traveled by individual particles, which are far more complicated than I expected.
Pathlines
Mouse over this image to animate the paths traveled by a line of particles released along a horizontal line through the centers of the vortex pair.
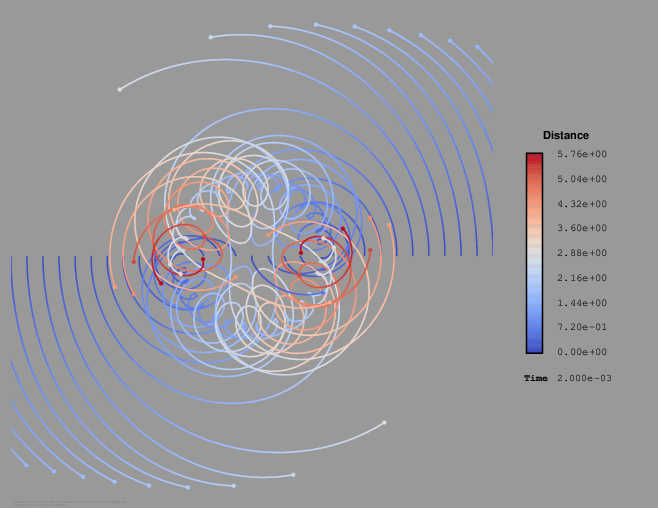
It's beautiful. It reminds me of Spirograph. It tells me that my ability to relate the instantaneous streamlines to the particle paths is rather feeble. I feel like I am getting to know this flow better now.
Streaklines
A streakline is the locus of particles released at the same spatial point but at different times in a flow. It represents an experimental situation in which a flow is visualized by continuously generating small bubbles or releasing dye at fixed positions in a flow. I have arranged their release along a horizontal line through the center of the vortexes.
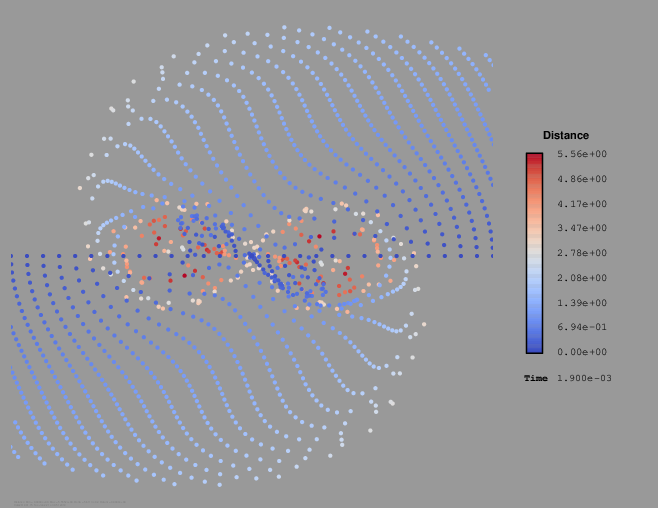
It's mesmerizing but I find it somewhat confusing. On the positive side, the characteristic hourglass shape of the streamline separating the vortex centers shows up clearly, unlike the pathline animation above. On the negative side, the streaklines quickly turn into an indistinct cloud of particles, leaving few clues about the history of the flow.
Comparing pathlines to streaklines
Below I compare pathlines and streaklines after 0.001 seconds of decay. In the streakline visualization shown on the right, the vortex centers quickly become a jumbled mess of particles, but lines of particles outside the vortex centers closely resemble the pathlines shown on the left. After this short amount of time the two representations are not terribly different.

After 0.002 seconds the streaklines outside the vortex centers still form distinct lines, but these no longer closely resemble the actual pathlines, having buckled in shape compared to them. Also the pathlines have begun to obscure the underlying topology of the flow, which remains clearly distinguished in the streakline visualization.
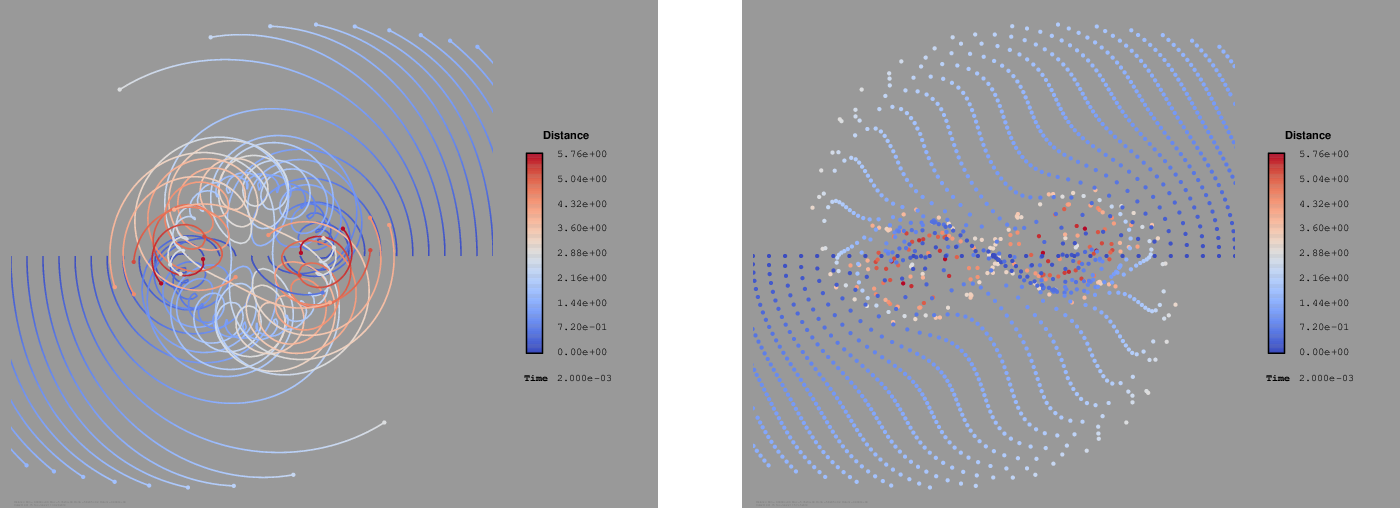
After 0.005 seconds the streaklines have begun to cross over themselves and now look quite different than the pathlines. The flow topology can still be faintly recognized at the center.
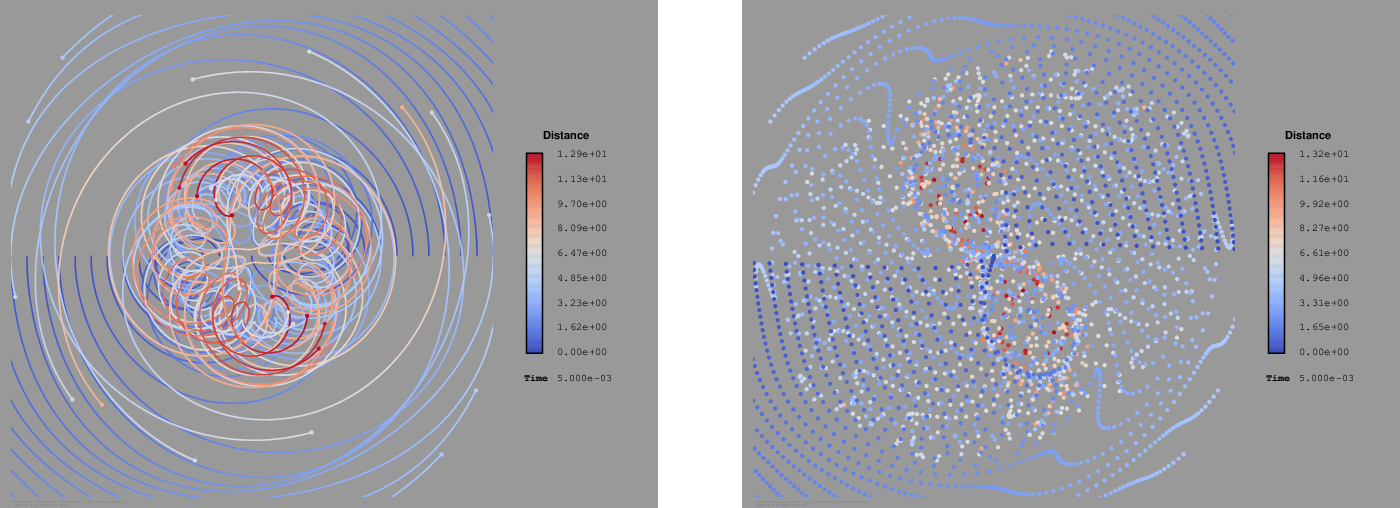
After 0.01 seconds particles with long lifetimes no longer remain in discernible lines in the streakline visualization and seem fairly uniform in their distribution. In the pathline visualization a ring shape region largely denuded of particles has appeared, but this seems to be an artifact of releasing all the particles at one time along a single line, which is arbitrarily restrictive.
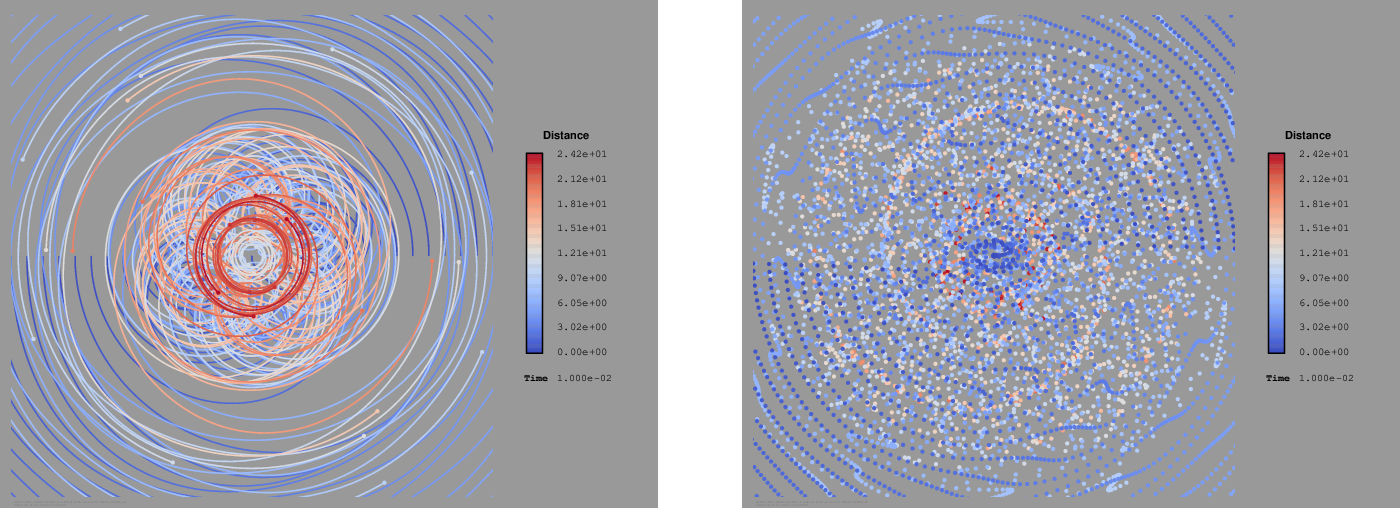
These two visualizations give a different look to the problem that I am still trying to digest.
Particle lines
We can see that pathlines and streaklines carried out to long times can lead to a crowded and confusing picture, especially if there are many of them. We can take several approaches to reduce the clutter. One approach is to release a line of particles and plot their position only, as shown below. By omitting the pathlines from the drawing we can release many particles without overcrowding the picture. Mouse over these images to see the action.

This visualization clearly portrays the dynamics of the vortex pair as it decays and merges. I've redone it below with the separation streamline overlaid to emphasize that white and black particles remain segregated in different lobes of the vortex pair and do not mix until the vortexes have merged.

If particles are released along a vertical line we get an entirely different picture. There are no particles enclosed in the lobes of the vortex pair, making it difficult to discern the nature of the flow.

When we visualize a flow by pathlines or streaklines, we can only sample a finite number of points, so we must sample carefully and be aware that no single picture can fully describe a nontrivial flow.
Guppies
Another alternative is to draw only the final part of the path so that each particle has a tail showing where it has most recently been:

Note that this can also be done with streaklines:

Here is a nice implementation that fades its tails rather than cutting them off sharply. The possibilities are endless.
Mass seeding of particles
Because there can never be too much beauty in the world.


