Cats2D Multiphysics > Research Topics > Visualizing rotation and extension in flow
All unpublished results shown here are Copyright © 2017–2019 Andrew Yeckel, all rights reserved
Visualizing rotation and extension in flow
A small but non-infinitesimal volume of fluid can experience shear and extensional deformation in addition to linear translation and rigid rotation. A useful discussion is found in Sec. 1.3.7 of these notes on kinematic decomposition of motion, and here too, particularly Sec. 3.6 on principal strain axes. Viewed this way, any incompressible flow can be characterized as a superposition of linear translation, rigid rotation, and pure extension. These concepts are illustrated below using visualizations of some basic flows.
Translation and rotation
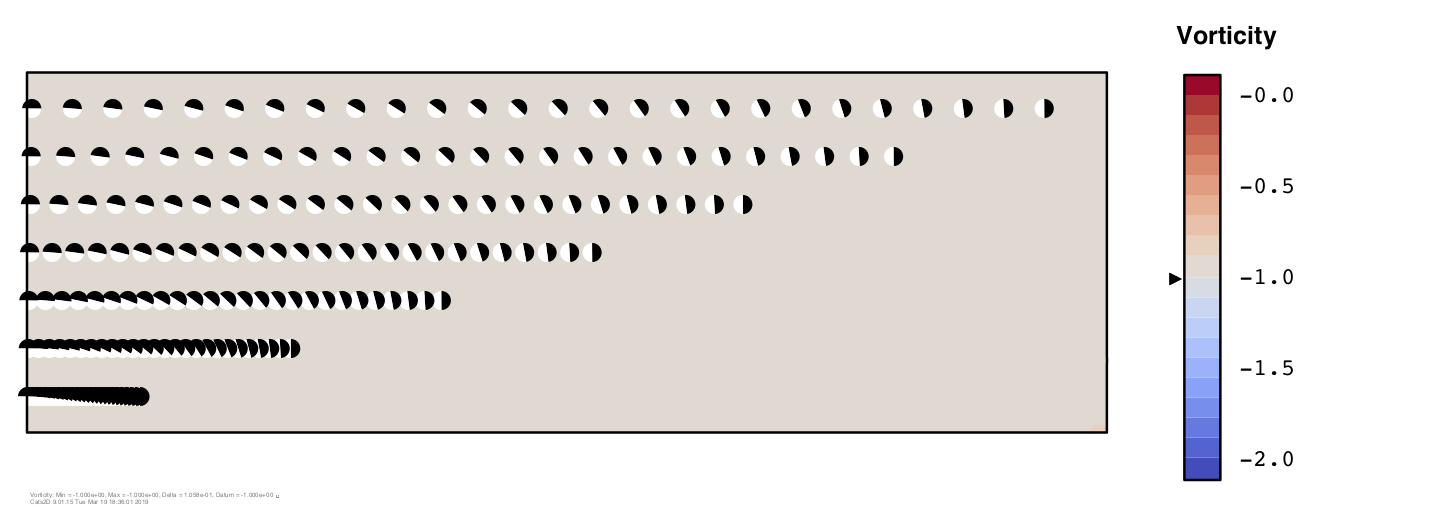
Below I show streaklines of particles in Couette flow. Vorticity is constant and we can see that particles released at the same time have all rotated the same amount regardless of velocity or distance traveled. The rotation rate is one half the vorticity in radians per time unit. After Pi time units the particles furthest to the right have rotated a quarter turn (Pi/2).

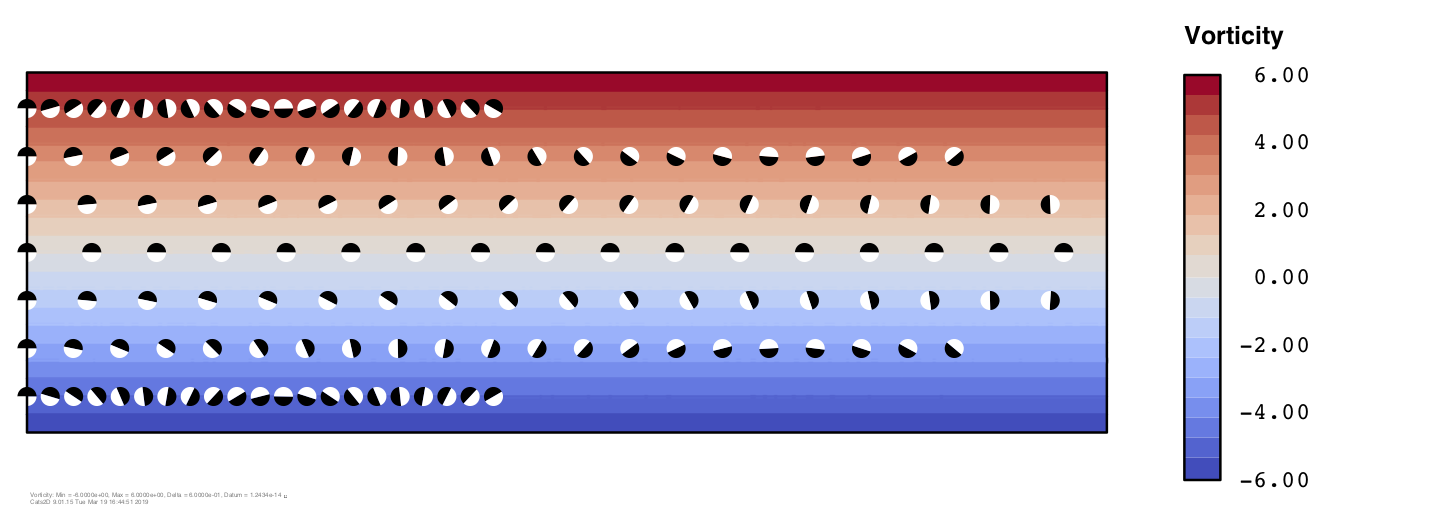
Shown next is Poiseuille flow in planar coordinates, which has a linear distribution of vorticity. Particles rotate clockwise in the lower half of the channel where vorticity is negative, and counter-clockwise in the upper half where vorticity is positive. Rotation is fastest near the walls and drops to zero at the center line, plainly evident from the absence of particle rotation there.

In Hill's spherical vortex, vorticity varies linearly from zero at the axial centerline to a maximum of 5 at the poles of the sphere, causing the particles to spin as they circulate. Mouse over the image below to see the effect of vorticity. The particles spin through 3/4 of a turn every time they orbit the vortex center, regardless of their initial position.

Mouse over the images to see the action when a line of particles is released into the Lamb-Oseen vortex pair in a periodic domain. Particles rotate at one-half the vorticity of the flow. Below left shows the full periodic cell, below right shows a close-up in slow motion.


These plots do a good job illustrating the translating, rolling motion of particles in various simple flows. But flows also commonly experience extension and compression, which can have a strong impact on polymer solutions and other liquids with strain-dependent properties.
Extension and compression
A non-infinitesimal volume of fluid experiences deformation in shear flow because one side of the particle is moving faster than the other. Particles are stretched at a 45 degree angle to the streamlines, illustrated in the sketch below. This special direction is a principal axis of stress, an axis along which flow is purely extensional.

In mathematical terms, the principal directions of a flow are given by the eigenvectors of the deviatoric stress tensor. For Newtonian and other isotropic fluids these axes are orthogonal to one another. The eigenvalues give the rate of expansion or compression along the principal axes. The trace of the tensor is zero for incompressible flow in Cartesian coordinates; hence, in planar two-dimensional problems, compression in one principal direction is always equal in magnitude to extension in the other direction. The trace is not zero in cylindrical coordinates because flow in the radial direction expands at a rate -2V/R because the coordinate system expands in that direction.
I have added a new vector plot type to Cats2D that shows the principal axis of extension in a flow scaled by the extension rate. Here is what it looks like for Poiseuille flow, where we see the same 45 degree angle everywhere, largest near the wall and zero at the center line.

Next I show the principal axis of extension in Hill's spherical vortex plotted on top of stream function contours. Along the vertical center line we can see that the principal axis forms a 45 degree angle with the streamlines, indicating shear flow. Near the horizontal center line, the angle is either close to zero or close to 90 degrees, indicating extension or compression. The largest rate of extension happens at the rear of the vortex (the left side), and the largest rate of compression occurs at the front of the vortex (the right side).

Elsewhere in the vortex the angle formed between the direction of flow and the principal axis of extension is intermediate between extensional and shear flow. I have added a new contour plot type to Cats2D that shows this quantity, the principal angle. In pure shear flow this angle equals 45 degrees, in pure extension it equals zero degrees, and in pure compression it equals 90 degrees. Shown below is the principal angle in Hill's spherical vortex, which has large areas of extension (blue) and compression (red) in the direction of flow. The angle is discontinuous at the center of the sphere, and it is singular at the vortex center, features which are awkward to depict using contours, so I've omitted contours in the upper half of the sphere. I think the continuous color image is more attractive without them.

In this animation we can see the line of particles extending in the blue regions and compressing in the red regions as it circles the sphere.

I am having a lot of fun playing around with these new types of plots, and I am rediscovering basic concepts in fluid dynamics at the same time. Cats2D would make a great teaching tool.
Appendix: Hill's spherical vortex
There is a wonderfully simple solution representing Stokes flow recirculating inside a sphere reported in 1884 by Micaiah John Muller Hill. In its stationary form, axial velocity (left to right in the picture below) is given by U = 1 - Z2 - 2 R2, and radial velocity (upward in the picture) is given by V = ZR. Streamlines of the exact solution are shown in the top half of the sphere, and streamlines computed by the Cats2D are shown in the bottom half. They are indistinguishable.

The velocity components are shown next, U in the top half and V in the bottom half of the sphere. These are computed by the code and they look identical to the exact solution given by the formulas above. The error between exact and computed solutions is 0.02% on this discretization of 71,364 equations.

This solution is particularly useful for testing derived quantities such as vorticity, pressure, and shear stress. The computation of these quantities is a complicated task in the code, and errors might be introduced in the post-processor even though the code computes the solution correctly. The analytical form of the exact solution is so simple it is possible to derive these quantities by inspection. Pressure equals -10Z, for example, and vorticity equals 5R. Computed values of these quantities are shown below and they match the exact solutions perfectly.

Similar plots can be made for normal and shear stresses, all components of which are linear in either R or Z.
Next I show principal stresses computed by the code. Extension is shown in the bottom half of the sphere and compression is shown in the top half. These match perfectly their analytical forms derived from the exact solution, which are nonlinear in R and Z with simple closed forms as roots of a quadratic equation.

These might appear to be weak tests with the notion that errors are masked by the apparently simple nature of the solution. But the equations were solved on the mesh shown below, the elements of which do not align with the coordinate directions. The equations are transformed to a local coordinate system on each element, and solution variables are interpolated in that system. Pressures and velocity gradients are discontinuous at element boundaries and must be smoothed by a least squares projection onto a continuous basis set before contouring. A myriad of things could go wrong that would show up very clearly in these plots.


We never tire of testing at Cats2D and I was gratified to verify all manner of derived variables in the post-processor against this exact solution. But Hill's spherical vortex is also great problem for working through basic concepts in fluid dynamics. Later I will post some instructive animations that illustrate the effect of vorticity in this flow, and I will also show some new vector plots of principal directions, or axes, of extension and compression that I've developed recently.