Cats2D Multiphysics > Research Topics > Computing accurate pathlines
All unpublished results shown here are Copyright © 2016–2019 Andrew Yeckel, all rights reserved
Computing accurate pathlines
I have collated a series of entries from my developments page into this article that document how I integrate particles pathlines and streaklines to very long times with high accuracy.
How to integrate pathlines of massless particles
I was having coffee at my morning hangout one day when I got pulled into the stream and carried away by a problem that has been troubling me for a long time. Why do time-integrated pathlines always look so terrible? Streamlines of a steady incompressible flow in two dimensions should either close on themselves or intersect inflow/outflow boundaries. They should not do things like spiral, which indicates failure to conserve mass, the grossest error one can commit when solving conservation laws (it is the zeroth moment, after all, and if you can't get that right, why bother).
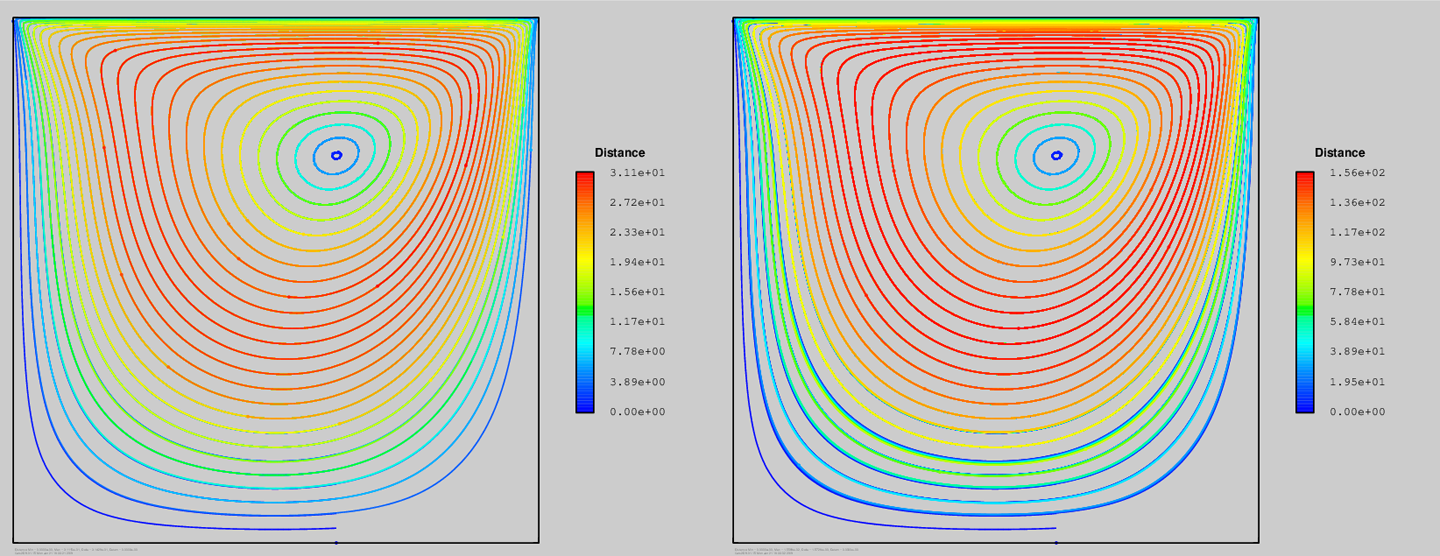
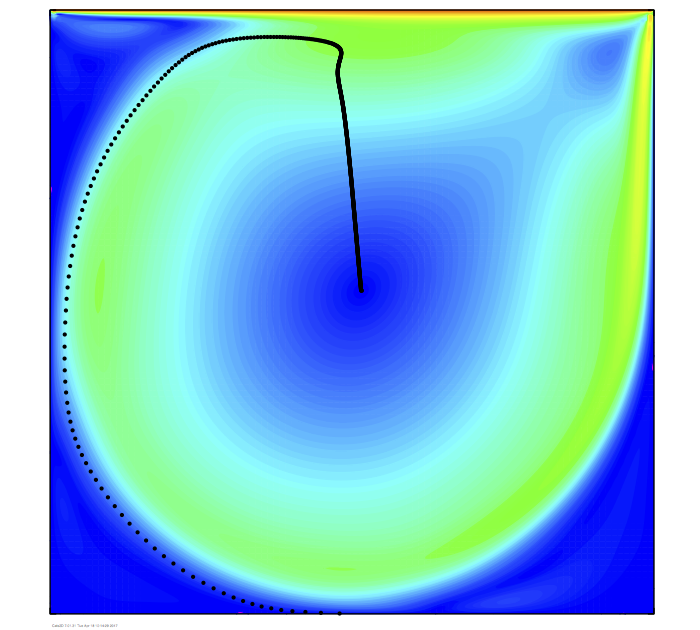
Yet every time-integrated pathline plot I've seen of a closed, steady flow shows streamlines that spiral, or terminate unexpectedly at walls. I knew I could do better on pathlines if I put some care into it, particularly since the methods of Cats2D do a fine job of conserving mass. I started out with the modest goal of integrating a closed pathline once around the loop accurately enough that it looks like a streamline contour. Here is what I achieved. Streamline contours are shown on the left and integrated pathlines on the right for the driven cavity at Re = 1000. How did I do?
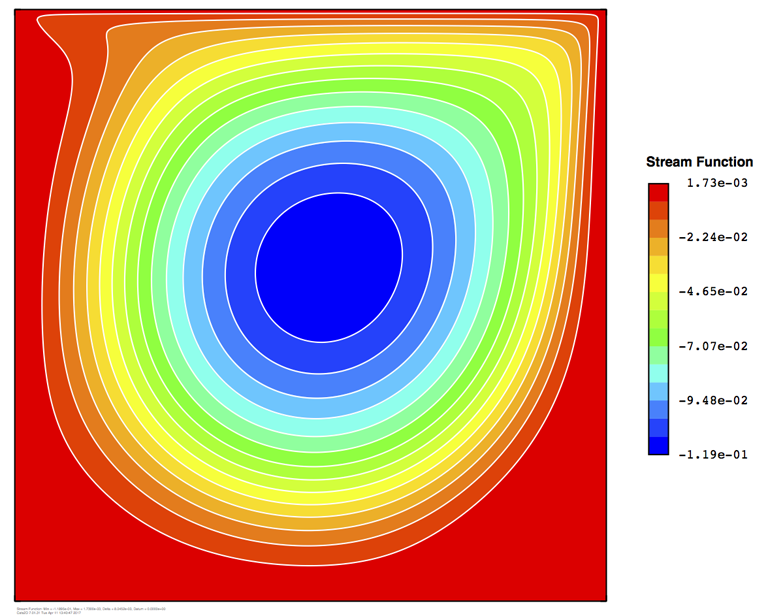
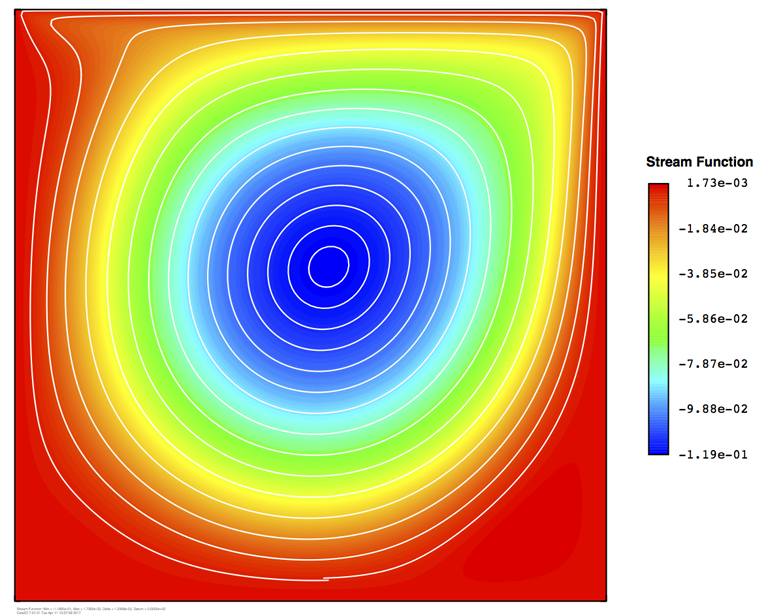
Pretty well, I think. There is a slight gap in the outermost pathline at the bottom, but otherwise the paths close nicely. The spacing is different because pathlines are computed at equal spatial intervals whereas contours are computed at equal intervals in stream function.
Whenever doing anything with the finite element method, you should always ask yourself "What is the Galerkin way?" This means doing everything consistent with your basis functions and the finite element paradigm. In this case the Galerkin way is to map the pathline equations to the parent element and carry out the integration there, rather than on the physical domain. The formalism is discussed in this brief note I've written.
Two major advantages are conferred by this mapping: (i) Adaptive time stepping becomes trivial because the solution is restricted to smooth behavior within the element by the low order basis set. Integration stiffness is taken care of simply by using an appropriate mesh to obtain an accurate solution to the flow. (ii) Element edges are defined by Xi or Eta equal to a constant, much simpler than the general expression for a line in a plane. This makes it easy to accurately determine the intersection of a path with the element edge and transfer its integration to the neighboring element. If this is not done very precisely, error in the path will rapidly accumulate, especially on fine grids.
I've put together an algorithm to compute pathlines based on fourth-order Runge Kutta time stepping within the elements. Initially I prototyped the algorithm with a forward Euler integration, but later tests revealed that RK4 was about five times as efficient at a given accuracy. The algorithm is arranged to slightly undershoot the element edge with the RK4 integration. A final small forward Euler step is taken to precisely reach the edge without round off error. Then the integration is transferred to the next element.
I've managed to do all this with sufficient care that pathlines can be integrated many times around a streamline with very little drift. To show this I've plotted pathlines colored by distance traveled, up to 40 cavity lengths, which is about 20 recirculations for all but a few outer pathlines. Below left shows the result on a 100x100 element mesh. The result is excellent except for a bit of drift in the outermost pathline. Refining the grid to 300x300 elements, shown below right, mostly eliminates this drift. The same thing can be accomplished by grading the elements on the 100x100 grid.

Plotting pathlines in lieu of streamlines doesn't make much sense in practice, although it might sometimes be advantageous to display contours at equal spatial intervals rather than at equal stream function intervals. When I started this work my immediate goal was to demonstrate that pathlines don't need to look terrible. My ultimate goal is to create a tool to animate motion of particles in a flow, which I will get to later. But in the course of this work it has became apparent that pathline integration can be exploited in several different ways to visualize a flow. Next I will show how the ability to compute such accurate trajectories allows us to do some very interesting things that hadn't occurred to me before.
Attention to every detail matters
After getting the pathline integration algorithm working, I started playing around with different ways to seed them and color them and so on. Then I made a plot like the one shown below, except that it looked uneven and ragged. That did not sit right with me. The locus formed by the little balls at the ends of the pathlines should be visually smooth in a plot like this. This alerted me to two minor mistakes in the algorithm that I fixed before making this exemplary plot:

I was integrating the pathlines accurately, but I hadn't been careful enough about the termination of integration. In a variable time stepping algorithm, it is necessary to intentionally adjust the final step size to precisely hit the prescribed integration limit. I wasn't making this adjustment, so each path terminated at a slightly different time. I fixed this flaw, but the picture still did not look this nice. Then I remembered that the algorithm does not draw a path segment for every time step, only when a segment reaches a critical length linked to plot resolution, and it wasn't drawing the final partial segment. Only when I fixed this did the plot look so good as shown here.
These adjustments were small, just slightly moving the balls, but large enough to have a critical effect on visual perception. It would not have been evident to make these adjustments if the pathline integration was not highly accurate. The point I am trying to make here is that any careless or inaccurate aspect of the algorithm messes up the appearance of this picture. Integrating, transferring, terminating, and drawing must all be done precisely to achieve this visual perception.
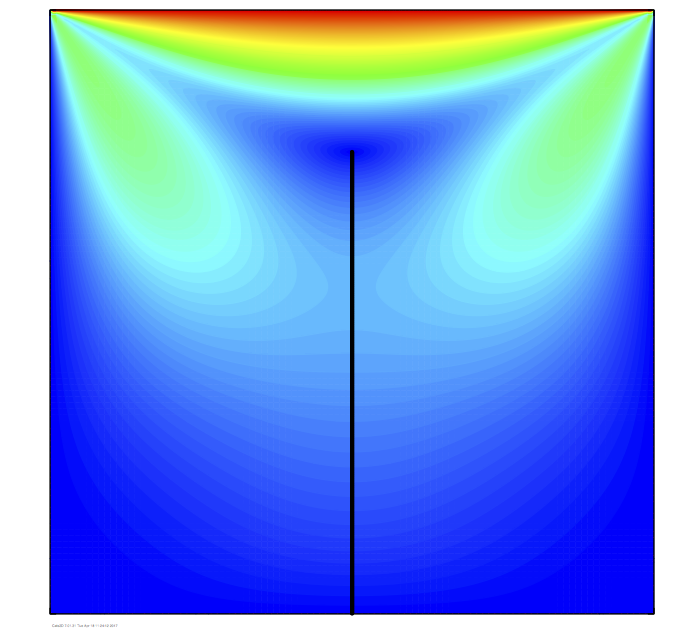
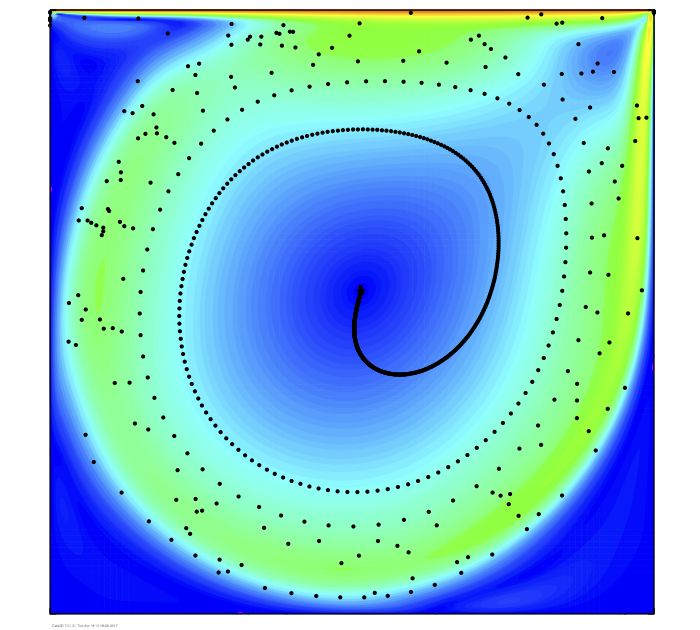
Here is an example of what can be done with all this accuracy. I've computed 1000 pathlines seeded along a vertical line between the bottom of the lid-driven cavity and the center of the primary vortex. Below left shows the initial positions of the particles, and below right shows the positions of the particles after 5 dimensionless time units of integration. Were velocity to increase proportional to radius, as in solid body rotation, the particles would remain in a straight line that rotates about the vortex center. For this Stokes flow, velocity falls off with radius except towards the lid, causing the line to spread out such that particles form a spiral instead. The picture is perhaps deceiving, suggesting that individual particles follow a spiral path towards the center when in fact they remain on the streamlines in this steady flow.
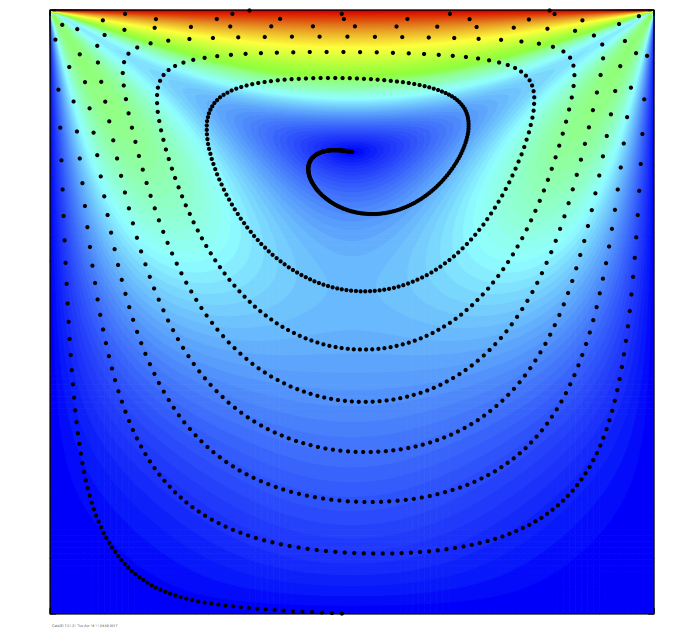
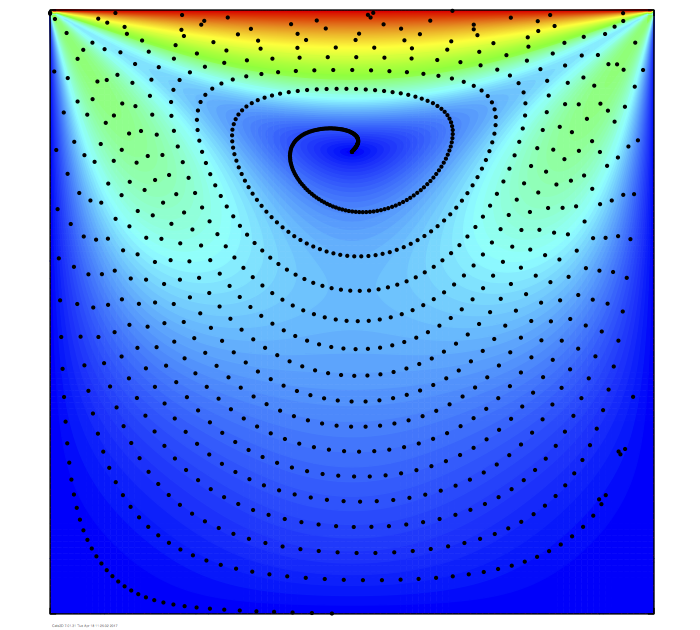
The number of spiral arms increases with integration time. Below left shows the situation after 10 time units, and it appears to have approximately twice as many arms as the case shown above on the right, indicating a linear relationship between number of arms and integration time. Another interesting feature emerges, and becomes quite obvious after 100 time units, shown below right, which is a transition between order and disorder that begins in the outer region and gradually moves towards the center.
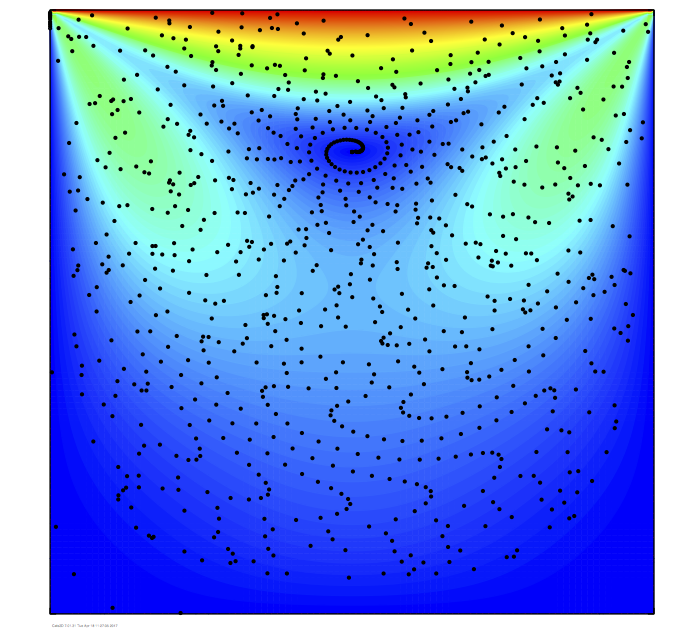
At first I thought this might be caused by accumulation of integration error, since the integration times are quite long. Tests showed, however, that this observation was quite insensitive to mesh refinement or time step size control. This is particularly true of the rate of progression of disorder towards the cavity center, strongly suggesting that the calculations have accurately captured the time scale of a physical rather than numerical phenomenon. So I think the effect is real. This is probably familiar ground to people who study vessel mixing.
In this next series I show the behavior in a strongly convected cavity flow computed at Re = 5000. This flow has a large central region nearly in solid body rotation, which tends to maintain coherence of the line of particles. Below left shows the situation after 0.5 time units and below right after 1 time units (1 time unit represents a single revolution of the core). The line of particles in the center slightly lags solid body rotation. In the outer part of the cavity viscous effects retard the flow and the particles spread out, eventually forming spiral arms and then disorder, but at a much slower rate.

Below left shows the distribution after 100 time units and below right after 400 time units. The region of order is still large after hundreds of rotations of the core.

Very interesting and it was just something I stumbled into when testing the pathline algorithm.
Mass seeding of particles
I just showed how a dense line of particles in an inertialess cavity flow spreads out to form a spiral arrangement that eventually transitions to a disordered distribution. When strong inertia is added to the flow, the initial line of particles persists and rotates about the center in the solid body core, but viscous effects of wall friction and flow separation in the corners eventually bring about the same general transition to disorder.
Here I take another look at this phenomenon by seeding a massive number of particles uniformly in the flow and integrating the pathlines for a long time. Shown below are the particles colored by distance traveled after 1 time unit (below left) and 10 time units (below right). Each time unit represents one recirculation of the solid body core of this flow. The appearance of order is readily evident within the primary vortex except at the outer edge of the red band, where a Chevron-like particle distribution has formed, outside of which there is disorder. As time proceeds this transition to disorder moves inward.
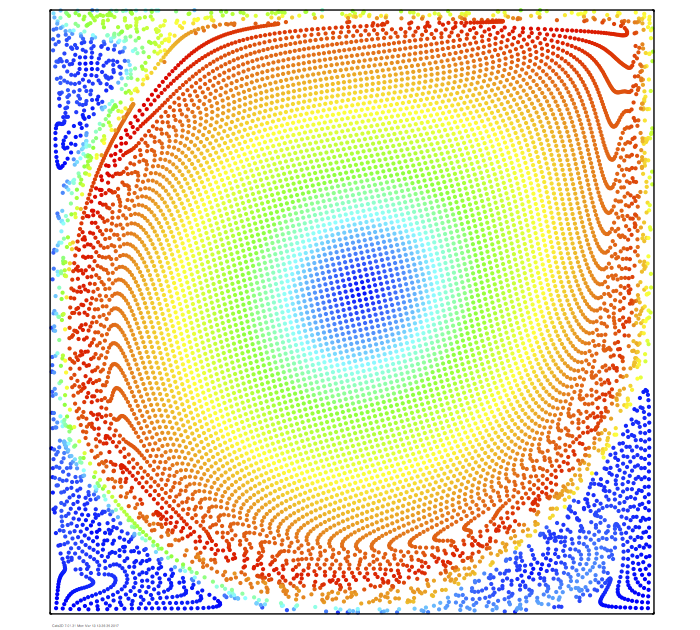

Shown below are the particles colored by distance traveled after 40 time units (below left) and 100 time units (below right). The order-disorder transition has progressed nearly to the center. These calculations were done on a 300x300 mesh of uniform elements, but I have done them on a much coarser 100x100 mesh and obtained very similar results. So I think this phenomenon is physical and not numerical in origin, but I defer to the mixing experts on what it actually means.
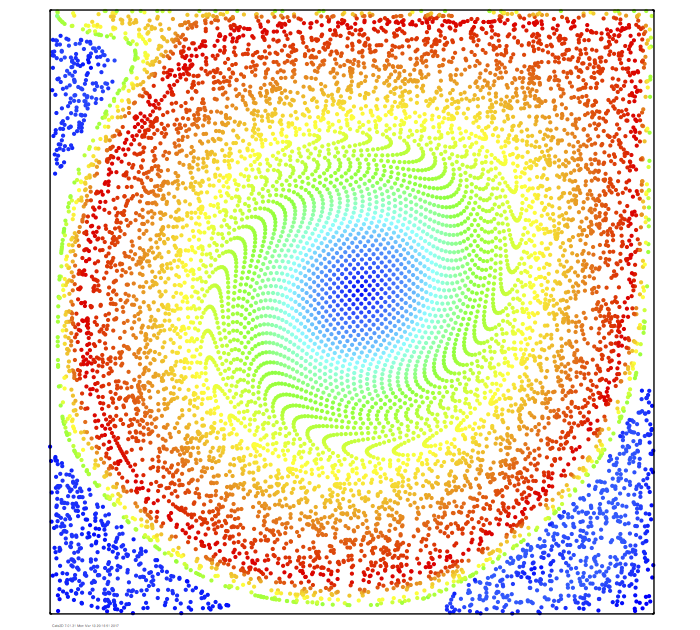
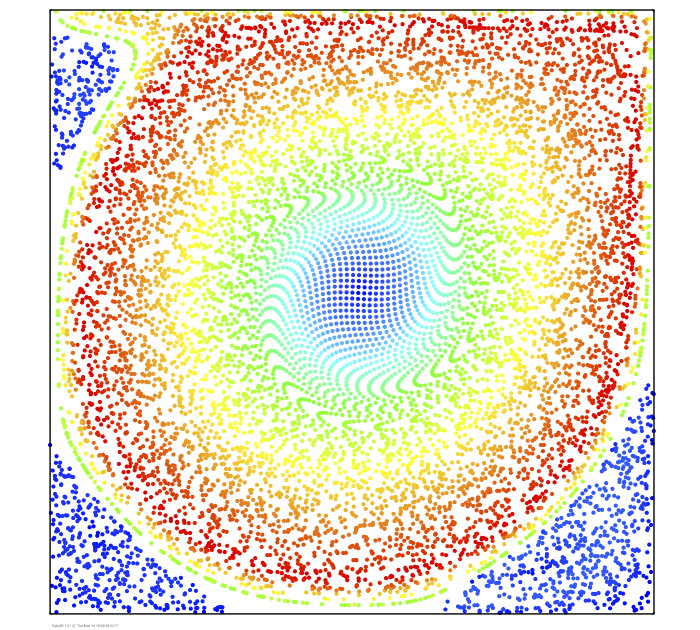
Ten thousand pathlines were integrated for up to one hundred recirculations each to make the lower right plot.
Mixing of a stratified liquid
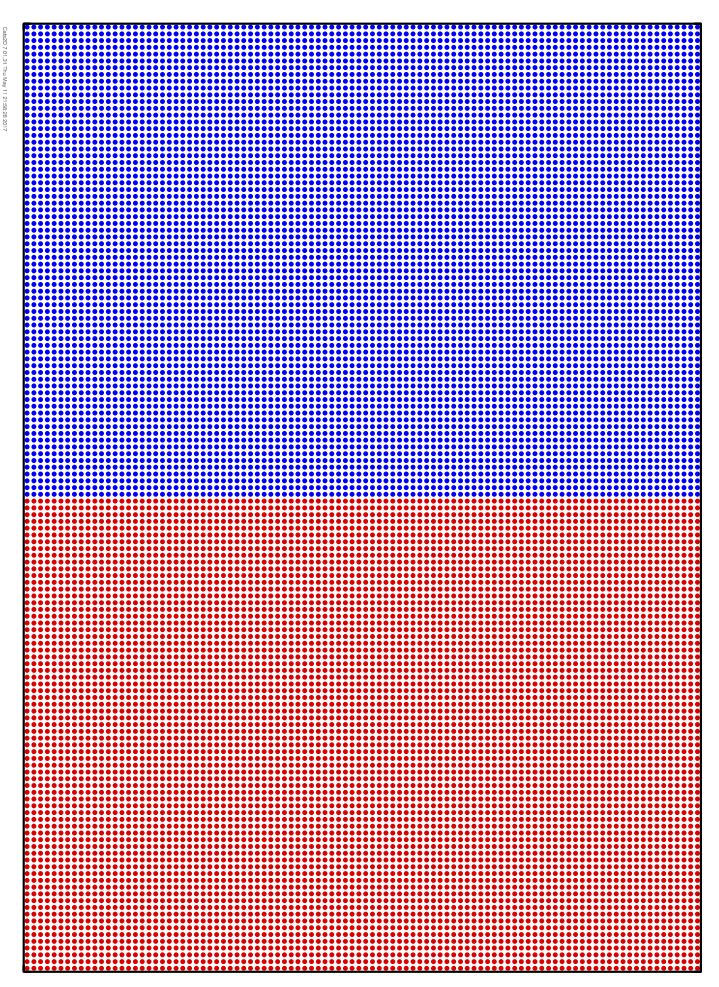
We just saw how a massive number of particles seeded on a uniform lattice become spatially disordered over time in a recirculating cavity flow. Long integration times were studied, up to 100 time units where one time unit corresponds approximately to one recirculation around the vortex center. For such results to be meaningful, integration of the pathlines must be extremely accurate. Indeed they are, as I demonstrate at the end of this entry. First, let's look at some results of mixing a stratified liquid. I've colored 14,000 particles red or blue by initial position and subjected them to the cavity flow shown below, which features two co-rotating vortexes driven by translation of the upper and lower boundaries in opposite directions.

Below is shown the result after 50 time units of mixing. The saddle streamline makes things stand out a bit more clearly. Particles inside of the lobes of this streamline are trapped there and do not cross the horizontal midline. Outside these lobes there is mixing, but striae rich in blue or red persist. The number of striae increases linearly with time.


The same calculation is repeated using black and white particles plotted on a background colored by the stream function. This gives the mesmerizing plots shown below. The striae show up more clearly in these plots.
Here is a slightly different problem, mixing of a linear concentration profile with color ranging continuously from red to blue. If I was asked to come up with one word to describe the plots shown below, it would be festive. I'm not sure why, but that's what comes to mind.
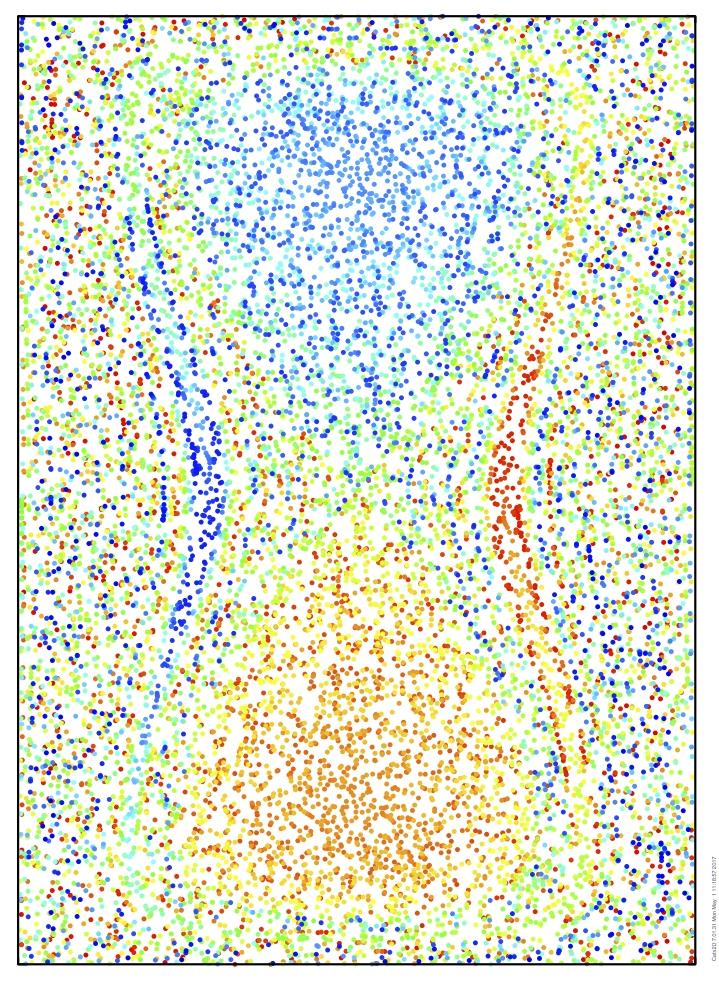

It's time for a show stopper and I'm going to pull it off with a dull looking result. This is a bona fide Goodwin challenge, something really nasty he thought up while eating his breakfast of charcoal and sawdust one morning. He pointed out that particle mixing ought to be reversible in these flows. He didn't make a big deal out of it, he just said it quietly and left it hanging there. The gauntlet thrown down, I knew I had to take one of these mixing results at long integration time and integrate it back to the starting time after reversing the flow. The particles are seeded on a uniform lattice and even a slight jiggling of their positions is very obvious to the eye. Unwinding the mixing shown above without leaving a jumbled mess seemed like hitting a hole-in-one in a gusty breeze, fourteen thousand times in a row. But we do not ask for quarter here, so I ran this test with my fingers crossed. On the left below we see a handful of defects in the final lattice. Overlaying the saddle streamline shows that the defects occur only near the walls or on the saddle streamline, where particles lose integration accuracy turning the sharp corner near the saddle stagnation point.
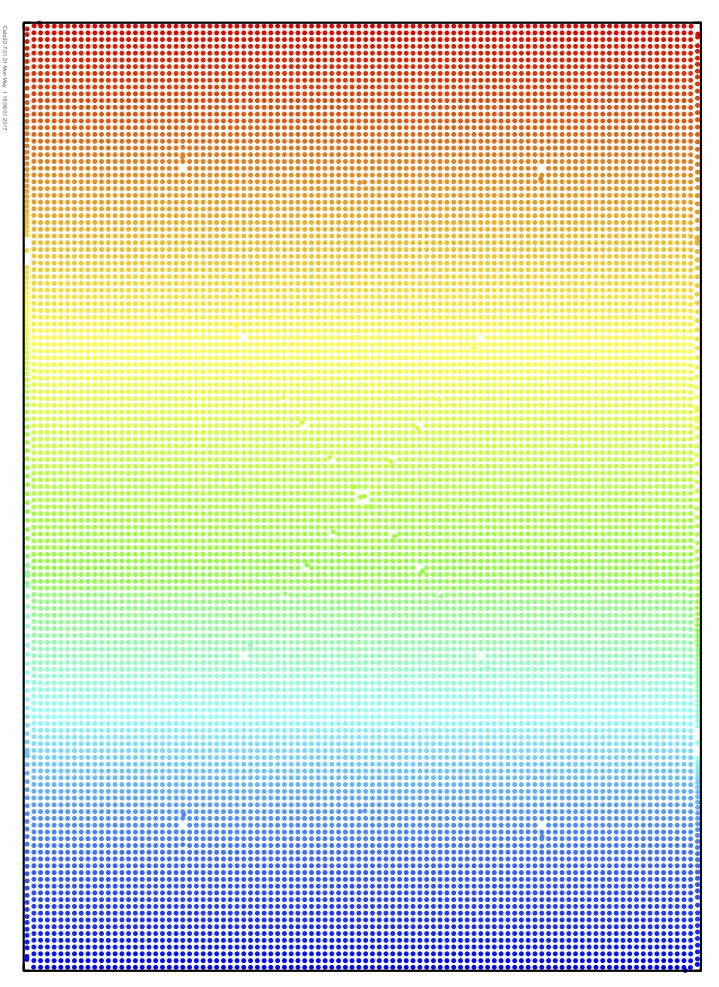
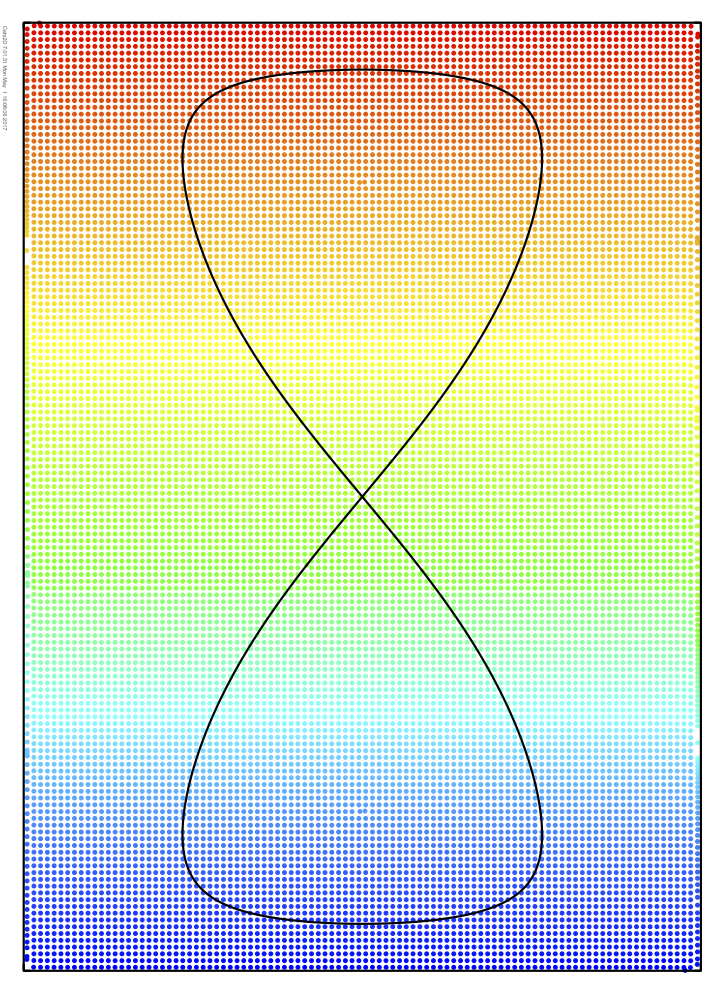
Everything considered, I'm calling this test one huge success. The average distance traveled by a particle in this calculation is 1,333 distance units, nearly 100 times the long span of the cavity. The particles traverse an average of 15,700 elements at five time steps per element before returning to their starting positions.
Comparing the accuracy of two types of finite elements
Cats2D uses a nine-noded element with biquadratic velocity and linear discontinuous pressure interpolation (Q2/P-1). This is a magic element that satisfies the LBB stability condition, meaning it is free of spurious pressure modes. It always delivers a solution, which fits the Cats2D "use it and forget it" philosophy. Another advantage is that mass is conserved exactly in an integral sense over each element. This is a strong statement of mass conservation compared to other typical LBB stable elements which lack this property, such as the biquadratic-bilinear (Q2/P1) element.
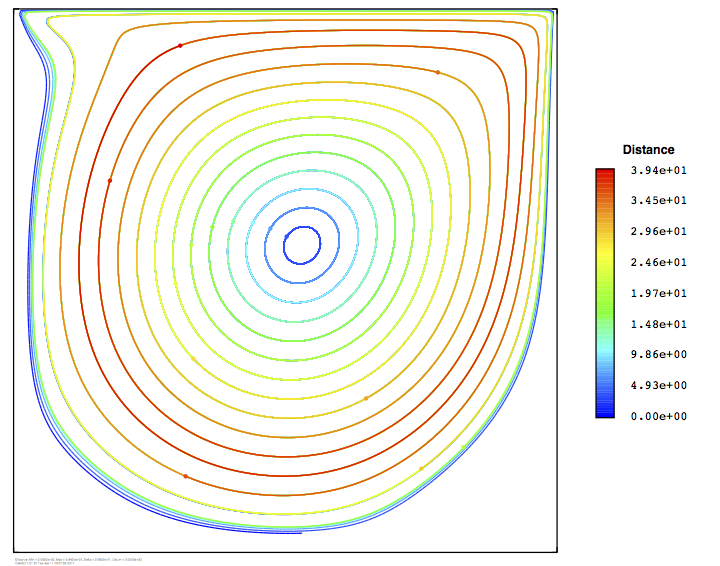
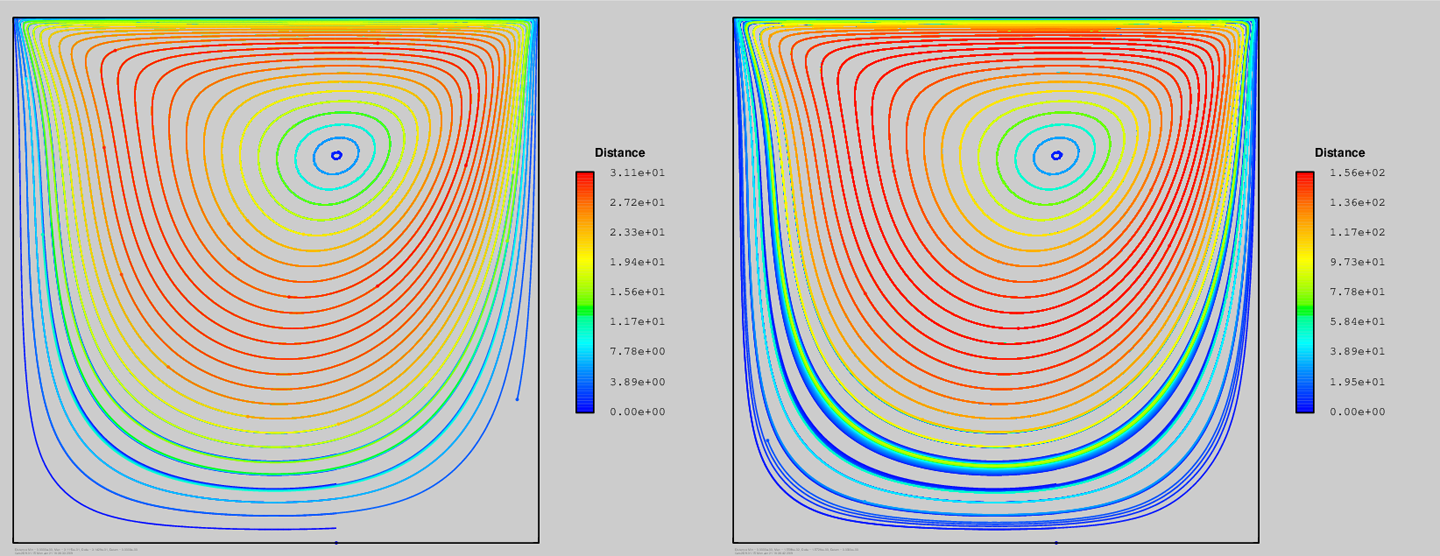
Very good pathlines can be produced using the biquadratic-linear discontinuous element. I show here pathlines for a lid-driven cavity flow at Re = 100 on a uniform mesh of 100x100 elements, after 1 time unit on the left and 5 time units on the right. After 5 time units some of the pathlines near the middle of the vortex have circled around more than 100 times without wandering at all. Some spreading has occurred that is most evident in the lower part of the cavity, particularly in one pathline that passes close to the corners of the lid where the velocity field cannot be accurately resolved. But performance is impressive overall.
The same test repeated with the biquadratic-bilinear element is shown below. Performance is very good in the middle of the cavity, but much worse in the lower part of the cavity. The bilinear pressure basis has three times fewer continuity constraints than the linear discontinuous basis, resulting in a less accurate pressure field and large local divergence in some parts of the mesh. In these results 1% of the elements have divergence > 0.001 and 0.1% have divergence > 1. I'm dissatisfied with its performance here, though I never use this element type anyway, simply because a continuous pressure basis is awkward to use in many of the problems that I solve.
This makes me wonder about stabilized finite element methods such as pressure-stabilized Petrov-Galerkin (PSPG) and Galerkin-Least Squares (GLS). Cats2D does not implement these methods currently so I cannot test them right now, but when I used them in the past I noticed they exhibited what seemed to me uncommonly large pointwise divergence within elements, often greater then 0.1. I conjecture this degrades pathline accuracy in these methods, but I need to carry out appropriate numerical tests to say for certain. If only there were more hours in the day.
Paint the sky with stars
I'm just having a little fun here. Mouse over this image to watch a line of 2043 particles flung into the heavens by a driven cavity flow. Color indicates velocity, which I've made parabolic rather than constant on the bottom surface to give a nicer picture. As always, it is based on a scrupulously accurate physical simulation.
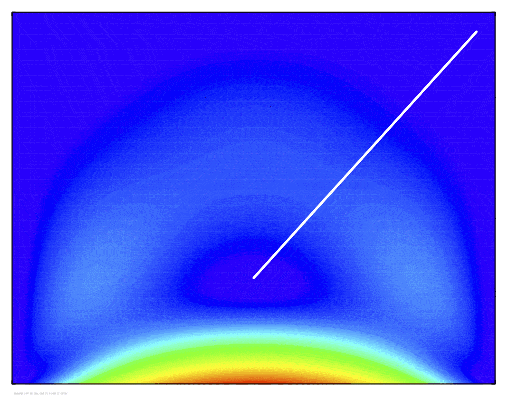
Paths were integrated for 500 dimensionless time units, which measures the number of times the line wraps around the vortex center. The appearance at times of a reversal in direction of rotation is a stroboscopic effect caused by interaction of frame rate with motion of the particles.
The particles appear to grow disordered quickly except near the center of the vortex, but occasionally ordered features suddenly emerge. These displays of local order continue to occur after hundreds of time units of mixing. In fact the appearance of widespread disorder is deceiving. Close examination reveals that ordered lines of particles move slowly along the boundaries long after mixing has begun. Eventually these lines are sucked into the faster moving central area of the flow where they are bent around into the sort of chevron pattern observed in my earlier study on particle mixing that I discuss in the "Magic carpet ride" entry further down this page.
This is a steady flow in which particles simply circle around closed streamlines, but it is easy to watch this animation and conclude there is some sort of underlying periodic nature to the flow causing these structures to appear. But the temporal behavior observed here is an artifact of the discrete spatial distribution of particles initially released into the flow. It is especially acute because the particles were seeded in a highly inhomogeneous way, packed along a single line like that.
Seeding particles on a uniform grid throughout the flow reduces but does not eliminate this kind of artifact. Massive seeding, such that particles fill the entire picture initially, brings about another artifact, the appearance of areas in the flow that appear devoid of particles after some time of mixing. These can be seen in results of my earlier studies, for example this picture from the "Lost in the hours" entry below:
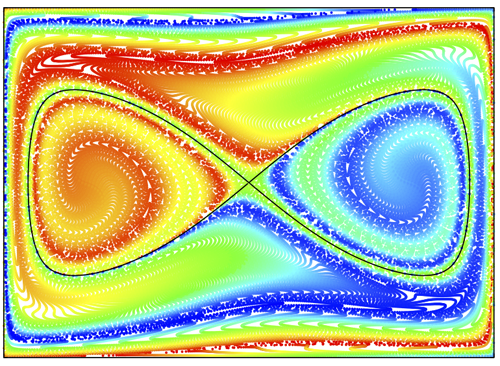
The accumulation of white space in places seems odd, but it is easy to overinterpret what we are seeing. These particles are infinitesimal objects to which we have given artificial form as visible dots to make this picture. In reality, at least as represented by this calculation, they have no mass and occupy no space. If represented precisely, this picture would be entirely devoid of visible particles. Because these dots cover up white space they do not occupy, and cover up each other too, white space is not conserved in these pictures, though our intuition would prefer it that way.
Perceptual difficulties seem to abound in flow visualization, lurking in spots we don't expect to find them.


